CONTENTS
Explore the dynamics of online shopping behavior through our sector-wise analysis of add to cart conversion rates.
From food to fashion, each sector offers a distinct narrative. Learn about the patterns and insights that drive user engagement without delving into specific statistics.
Sector-wise Analysis of Average Shopping Cart Conversion Rates
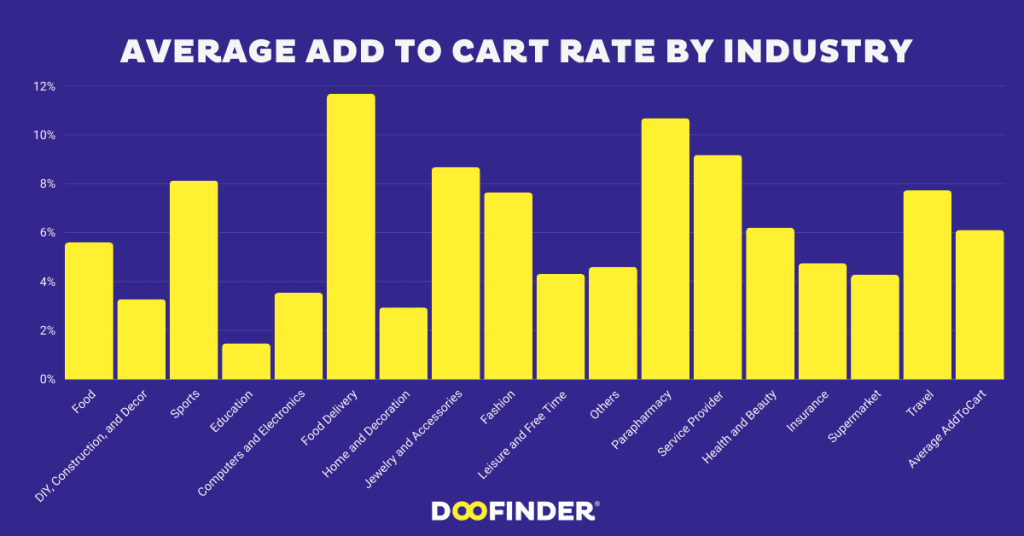
1. Food – 5.60%
The food industry demonstrates a steady 5.60% add to cart rate, highlighting the effectiveness of enticing users to explore and add culinary delights to their digital carts.
2. DIY, Construction, and Decor – 3.28%
In the realm of DIY and decor, a 3.28% cart conversion rate suggests that users are more thoughtful in this sector, considering and adding products with care.
3. Sports – 8.13%
Sports enthusiasts exhibit an impressive 8.13% add-to-cart rate, showcasing a strong connection between engaged users and products related to sports and fitness.
4. Education – 1.47%
The education sector, with a 1.47% cart conversion rate, reflects a more deliberate decision-making process, as users carefully select educational materials.
5. Computers and Electronics – 3.54%
Tech-savvy consumers in the computers and electronics sector contribute to a 3.54% add to cart rate, emphasizing the need for enticing product information.
6. Food Delivery – 11.67%
The food delivery sector leads with an outstanding 11.67% add-to-cart rate, showcasing immediate intent and a seamless transition from selection to checkout.
7. Home and Decoration – 2.94%
Home and decoration items see a 2.94% cart conversion rate, indicating a discerning audience that carefully curates their cart with decor choices.
8. Jewelry and Accessories – 8.68%
In fashion accessories, an 8.68% shopping cart conversion rate reveals a high level of interest and commitment from users exploring jewelry and accessories.
9. Fashion – 7.65%
The fashion industry maintains a strong 7.65% add to cart rate, illustrating a balance between spontaneous interest and thoughtful selection.
10. Leisure and Free Time – 4.31%
Leisure and free-time activities generate a 4.31% shopping cart conversion rate, indicating users’ willingness to explore and commit to hobbies and entertainment.
The Average Add to Cart Rate
The average add to cart rate is 6.11%.
This metric represents the percentage of website visitors who add at least one item to their digital shopping cart.
It serves as a baseline for understanding user engagement and purchase intent.
Shopping Cart Conversion Rate FAQs
1. What is add to cart rate?
The “add to cart rate” is a crucial metric in e-commerce that measures the percentage of website visitors who add at least one item to their digital shopping cart.
Represented as a percentage, this rate provides insights into user engagement and the effectiveness of a website in converting browsing activity into tangible product interest.
A higher add-to-cart rate generally indicates a more engaged and interested audience, while a lower rate may suggest potential challenges in capturing visitor interest or promoting seamless interactions with the online shopping experience.
2. What’s a good add to cart rate?
Defining a “good” add to cart rate depends on the industry.
While 6.11% is the overall average, optimal rates vary across sectors.
Industries with rates consistently surpassing this average are considered to have strong user engagement and conversion potential.
Ready to discover more?

Acknowledgment of Sources: The content we provide relies on reputable and credible sources, including Statista, Insider Intelligence, Data Reportal, and Census.gov. These platforms are recognized for delivering accurate and reliable data, ensuring the quality and integrity of the information presented.


