CONTENTS
The landscape of holiday retail sales in the United States has undergone a remarkable transformation over the past five years, with each festive season unveiling new milestones and challenges.
From 2018 to 2023, the sector witnessed a consistent upward trajectory, defying obstacles ranging from economic uncertainties to the unprecedented disruptions caused by the global pandemic.
Holiday Spending Statistics in the US
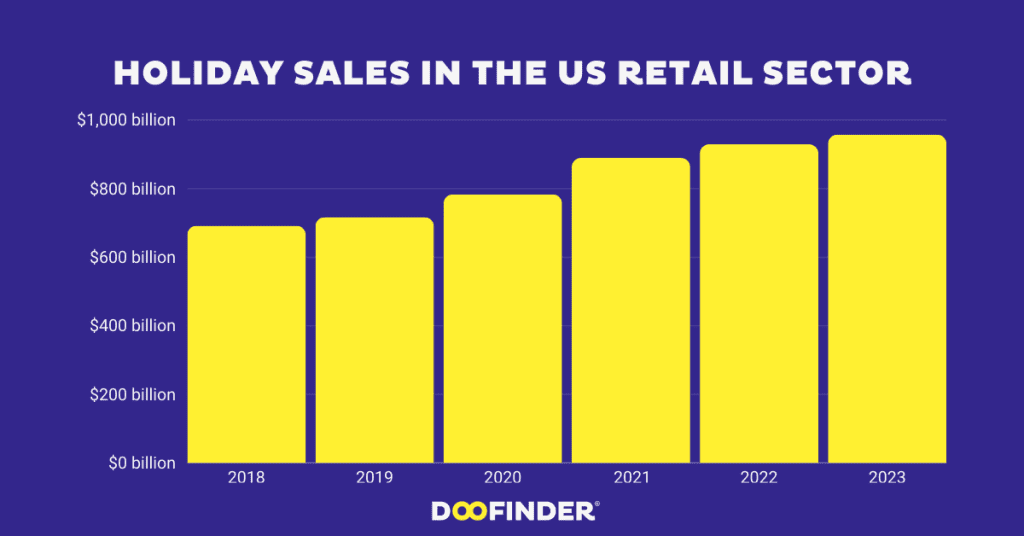
2018: $691.8 Billion
- The holiday retail season in 2018 commenced with consumers spending $691.8 billion.
- This marked the beginning of a period of substantial growth in the following years.
2019: $716.7 Billion
- The momentum continued in 2019, with holiday retail sales reaching $716.7 billion.
- Demonstrated a positive trend in consumer spending during the festive season.
2020: $783.4 Billion
- Despite challenges posed by the pandemic, holiday retail sales in 2020 grew to $783.4 billion.
- Showcased resilience in the face of unprecedented circumstances.
2021: $889.3 Billion
- Witnessed an extraordinary surge in 2021, reaching a record-breaking $889.3 billion.
- Marked a remarkable year-over-year increase of 13.5%, surpassing expectations despite challenges.
2022: $929.5 Billion
- Continued the upward trajectory in 2022 despite challenges such as rising inflation.
- Sales grew by 5.3%, reaching an unprecedented $929.5 billion, setting a new record.
- Outpaced the 10-year average growth rate, indicating sector resilience.
2023: Anticipating Continued Growth at $957.3 Billion
- Projections for 2023 anticipate continued growth, with sales expected to reach $957.3 billion.
- Building on positive trends from previous years, the industry remains poised for robust holiday retail sales.
E-commerce and Non-Store Sales: A Driving Force
- Throughout the decade, e-commerce and non-store sales emerged as key players in holiday retail growth.
- In 2022, these channels played a pivotal role, experiencing a 9.5% surge, showcasing the increasing preference for online shopping.
Sector-wise Contributions in 2022:
- Grocery and Beverage Stores (7.8% Growth): Online shopping for essential products contributed to a significant increase in sales.
- General Merchandise Stores (3.8% Growth): Played a role in the overall positive trend in the sector.
- Sporting Goods Stores (3.5% Growth): Indicative of consumer interest in sports-related products, contributing to the 2022 growth.
Retail Retail Sales Statistics in the US
In conclusion, the US holiday retail sector has experienced substantial growth from 2018 to 2023, navigating challenges and setting new records. Projections for the upcoming year suggest a continuation of the positive trend, highlighting the industry’s resilience and adaptability.
Ready to discover more?
- Small Businesses in California
- US Media Consumption (2018–2024)
- eCommerce Platform Market Share in the US
Information Source Acknowledgment: Our content is supported by data obtained from credible platforms, including Statista, Insider Intelligence, Data Reportal, and Census.gov. These sources are recognized for delivering reliable and current information.


