CONTENTS
Embark on a journey through the dynamic realm of mobile e-commerce conversion rates, exploring the highs and lows.
These monthly figures offer valuable insights into the ever-evolving world of online shopping on mobile devices.
Average Mobile Conversion Rates

January: 2.46%
The year kicked off with a mobile e-commerce conversion rate of 2.46%. This modest start suggests a steady engagement but also sets the stage for potential improvements. The average mobile conversion rate in January lays the foundation, indicating the baseline for subsequent months.
February: 2.45%
February saw a slight dip to 2.45%, showcasing the variability in mobile conversion rates. Despite the decrease, the figure remains within a close range, emphasizing stability. A marginal decline prompts exploration into factors influencing user behavior and potential optimizations.
March: 2.86%
March witnessed an uptick to 2.86%, marking a notable improvement. The increase suggests successful strategies or user experience enhancements. Positive momentum in March signals the potential impact of optimization efforts on mobile conversion rates.
April: 2.73%
April experienced a minor decrease to 2.73%. Though a dip, the rate remains above the January baseline, indicating resilience in mobile conversion. Fluctuations prompt a closer look at user interaction patterns and potential areas for improvement.
May: 3.18%
May marked a significant boost to 3.18%, signifying a noteworthy increase in mobile e-commerce conversion rates. This spike could be attributed to successful campaigns or enhanced mobile user experiences. The surge in May highlights the potential impact of targeted strategies on driving mobile conversions.
June: 3.02%
June maintained the positive trend with a 3.02% conversion rate. Consistency in higher rates suggests sustained effectiveness in mobile e-commerce strategies. The stable increase reflects the potential success of ongoing optimization efforts.
July: 2.91%
July witnessed a slight dip to 2.91%, indicating some fluctuation in mobile conversion rates. Understanding these variations is crucial for refining mobile strategies. Monitoring fluctuations aids in adapting strategies to maintain or improve conversion rates.
August: 2.86%
August maintained stability with a 2.86% conversion rate. This consistency suggests a solid baseline for mobile e-commerce performance. A steady rate in August reinforces the importance of sustained efforts for optimal mobile conversions.
September: 2.80%
September saw a marginal decline to 2.80%. While a dip, the rate remains within the range observed earlier in the year. Evaluating factors contributing to variations helps in devising strategies for mobile conversion rate optimization.
October: 2.88%
October rebounded slightly to 2.88%, showcasing resilience. Understanding these fluctuations is essential for devising strategies to maintain or enhance conversion rates. Recovery in October suggests adaptability and potential for targeted improvements.
November: 4.12%
November witnessed a remarkable spike to 4.12%, indicating a substantial increase in mobile e-commerce conversion rates. This surge could be attributed to seasonal trends or successful campaigns. The exceptional rise in November prompts exploration into the specific factors contributing to this surge.
December: 3.74%
The year concluded on a positive note with a 3.74% mobile conversion rate in December. The rate, while slightly lower than November, remains elevated compared to earlier months. Ending the year with a strong conversion rate indicates the potential impact of end-of-year promotions and user engagement strategies.
What is a Good Mobile E-Commerce Conversion Rate?
Defining a “good” mobile e-commerce conversion rate can vary based on industry standards and business goals.
From the data provided in this article, the average of the monthly mobile e-commerce conversion rates for the year is approximately 3.01%.
This calculation takes into account the varying rates observed each month, showcasing both fluctuations and overall stability in mobile conversion performance throughout the year.
Generally, rates above 3% are considered satisfactory, and rates exceeding 5% are exceptional.
However, it’s crucial to consider factors like industry benchmarks, target audience, and the complexity of the purchasing process.
Regularly assessing and optimizing strategies is key to achieving and surpassing a good mobile e-commerce conversion rate.
Optimizing Your Mobile eCommerce Conversion Rate
As we reflect on the mobile e-commerce conversion rates of 2023, it’s evident that the landscape is dynamic, with fluctuations influenced by various factors.
The key lies in continuous adaptation and optimization. Understanding user behavior, refining strategies, and embracing the insights gained from monthly variations will pave the way for sustained growth in mobile conversions.
In 2023, each fluctuation offers an opportunity to refine tactics and enhance the mobile shopping experience, ultimately steering towards higher and more consistent conversion rates.
Ready to discover more?
- US eCommerce Sales (2018-2028)
- eCommerce Penetration in the US (2019 – 2028)
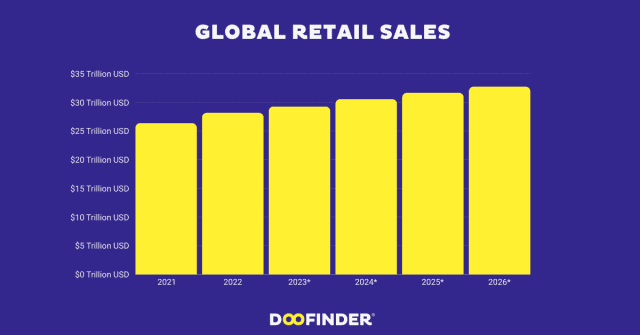
- Global Sales: Retail Sales Numbers from 2021 – 2026

Information Source Disclosure: Our content is backed by data sourced from various reputable outlets. Key contributors to our statistical insights include platforms like Statista, Insider Intelligence, Data Reportal, and Census.gov, known for their commitment to reliable and current information.


