CONTENTS
Walmart’s revenue, or turnover, has shown consistent growth over the years, driven by strategic adaptations to changing market conditions and an expanding digital presence.
By leveraging its physical stores and e-commerce platforms, Walmart has solidified its position as a retail giant.
But how much money did Walmart make last year? Let’s break it down.
Below is a detailed breakdown of Walmart’s annual revenue from fiscal year 2014 through fiscal year 2024, along with key quarterly performance data starting from 2020.
This analysis answers the common question, “What is Walmart’s annual revenue?”.
Walmart Worldwide Revenue (FY 2014 – 2024)
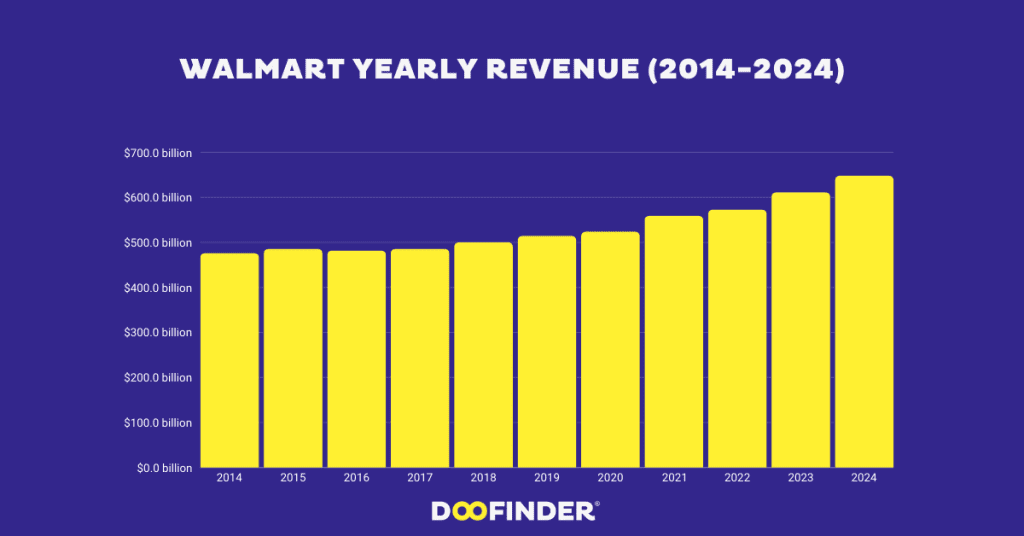
- 2014: $476.29 billion
- 2015: $485.65 billion (1.97% YoY growth)
- 2016: $482.13 billion (-0.73% YoY decline)
- 2017: $485.87 billion (0.78% YoY growth)
- 2018: $500.34 billion (2.97% YoY growth)
- 2019: $514.41 billion (2.81% YoY growth)
- 2020: $523.96 billion (1.86% YoY growth)
- 2021: $559.15 billion (6.72% YoY growth)
- 2022: $572.75 billion (2.43% YoY growth)
- 2023: $611.29 billion (6.73% YoY growth)
- 2024: $648.13 billion (6.03% YoY growth)
This data highlights the annual revenue of Walmart and showcases its ability to grow consistently, even in challenging times.
Key Commentary:
Walmart’s annual income has shown steady growth from 2014 to 2024, with only minor dips, notably in 2016.
The most significant growth years were 2021 and 2023, likely driven by increased consumer demand during and after the pandemic.
Walmart’s gross revenue saw a notable acceleration from 2021 onward, a testament to the company’s successful adaptation to new market dynamics, such as an increase in online shopping.
The yearly revenue of Walmart has consistently risen, proving the effectiveness of its business strategies.
Walmart Quarterly Revenue (Q1 2020 – Q2 2024)
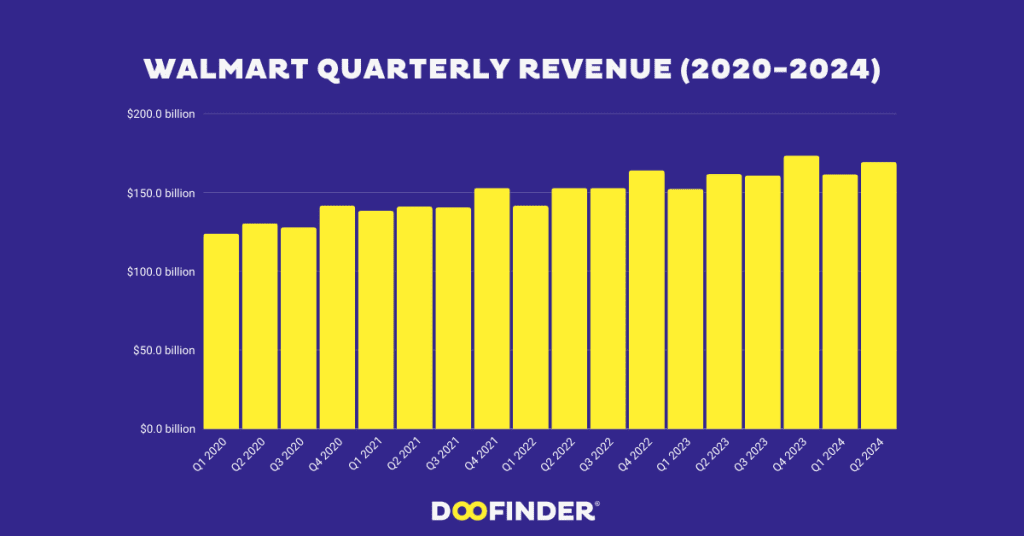
- Q1 2020: $123.93 billion
- Q2 2020: $130.38 billion (5.21% QoQ growth)
- Q3 2020: $127.99 billion (-1.83% QoQ decline)
- Q4 2020: $141.67 billion (10.69% QoQ growth)
- Q1 2021: $138.31 billion (-2.37% QoQ decline)
- Q2 2021: $141.05 billion (1.98% QoQ growth)
- Q3 2021: $140.53 billion (-0.37% QoQ decline)
- Q4 2021: $152.87 billion (8.77% QoQ growth)
- Q1 2022: $141.57 billion (-7.40% QoQ decline)
- Q2 2022: $152.86 billion (7.99% QoQ growth)
- Q3 2022: $152.81 billion (-0.03% QoQ decline)
- Q4 2022: $164.05 billion (7.34% QoQ growth)
- Q1 2023: $152.30 billion (-7.16% QoQ decline)
- Q2 2023: $161.63 billion (6.12% QoQ growth)
- Q3 2023: $160.80 billion (-0.51% QoQ decline)
- Q4 2023: $173.39 billion (7.82% QoQ growth)
- Q1 2024: $161.51 billion (-6.87% QoQ decline)
- Q2 2024: $169.34 billion (4.84% QoQ growth)
This quarterly data provides insights into Walmart’s total revenue per year, breaking it down into quarters to show seasonal trends and year-over-year growth.
Key Commentary:
Walmart’s revenue by year and by quarter follows a typical seasonal pattern. Q4 consistently sees the highest spikes each year due to increased holiday spending, while Q1 typically experiences a post-holiday dip.
The pandemic years of 2020 and 2021 were especially strong, as Walmart’s gross revenue surged in response to shifts in consumer behavior, particularly an increase in demand for essential goods and online shopping.
Since 2020, Walmart’s total revenue has stabilized, with steady growth in both its physical stores and digital platforms, solidifying its omnichannel presence.
Key Drivers of Walmart’s Revenue Growth
- E-commerce Expansion: Walmart’s investment in digital platforms has significantly boosted Walmart’s annual sales, especially during the pandemic. This seamless integration of physical stores with e-commerce offerings has played a crucial role in driving up Walmart’s yearly revenue.
- Value-Based Retail: As inflation rises, consumers have turned to Walmart for its competitive pricing, contributing to the increase in Walmart’s gross revenue. Offering value-based shopping options has been a critical factor in maintaining strong Walmart annual income.
- Omnichannel Strategy: By combining the convenience of online shopping with the accessibility of in-store services, Walmart’s strategy has not only increased customer satisfaction but also significantly enhanced Walmart’s total revenue per year. This omnichannel approach has been key to its continued success.
Walmart Market Cap and Financial Health
In addition to strong revenue growth, Walmart’s market cap continues to reflect the company’s financial health and investor confidence.
As the company expands its reach through digital innovation and value-driven retail strategies, it is well-positioned to maintain its growth trajectory and further increase its market cap in the coming years.
With its strategic focus on digital transformation, value-based pricing, and an effective omnichannel strategy, Walmart remains a dominant force in both physical and online retail.
As seen from its consistent revenue by year, Walmart is set to maintain its strong performance and continue to meet the evolving needs of its diverse customer base.
The Future of Walmart’s Yearly Revenue
From $446.51 billion in FY 2012 to a projected $648.13 billion in FY 2024, Walmart’s yearly revenue reflects the company’s ability to adapt and grow.
The company’s quarter-by-quarter performance highlights its strength in catering to consumer needs, both in physical and digital spaces.
Whether you’re asking, “How much money has Walmart made?” or “What is Walmart’s annual revenue?”, the numbers demonstrate consistent growth in Walmart’s annual income and operational success.
This analysis provides a clear snapshot of Walmart’s revenue by year, showcasing its leadership in the retail industry and its strategic efforts to meet consumer demand.
Source Acknowledgment: We base our content on credible sources like Statista, Insider Intelligence, Data Reportal, and Census.gov, recognized for their accuracy and reliability, thereby ensuring the credibility of the information we provide.
- Increase your eCommerce sales by 20%
- The 10 largest eCommerce sites in the world
- How to start an online shop from scratch


