CONTENTS
Entrepreneurship in the U.S. is booming, with record numbers of people starting new businesses in recent years.
Let’s take a closer look at the trends, the top industries for new business applications, and which states are leading the way.
How many businesses are launched each year?
The number of new businesses launched each year has changed a lot in recent years.
Factors like the economy and global events have influenced these trends.
This section looks at the ups and downs in business applications, showing how entrepreneurship is growing and evolving, especially after the pandemic.
1. Annual Change in New Business Applications by Year
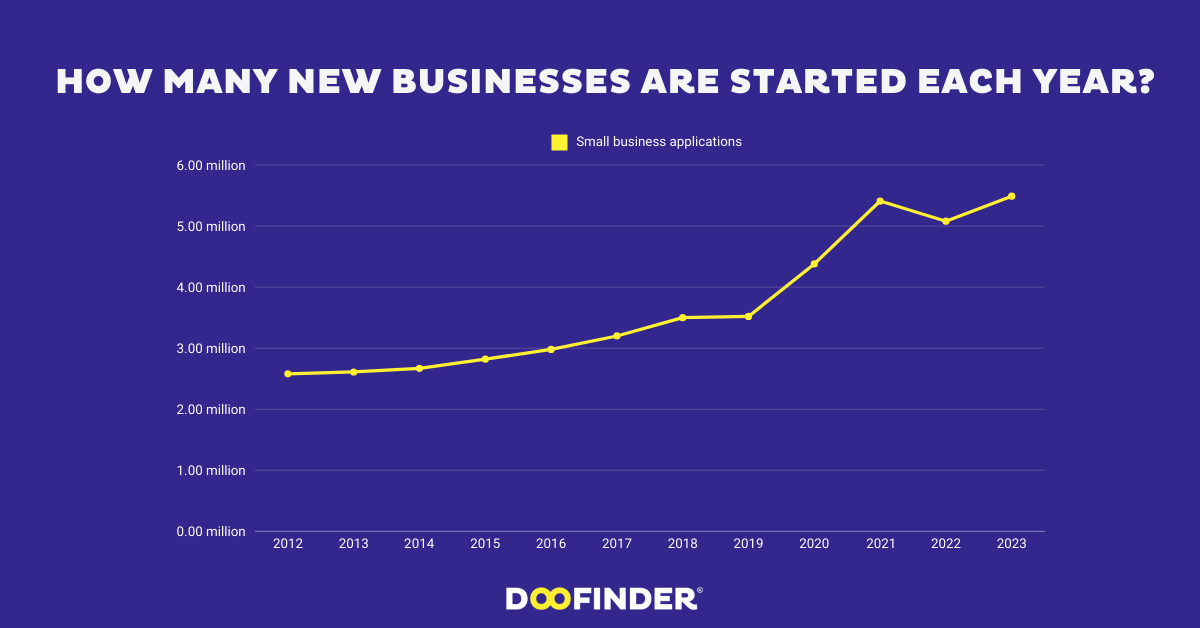
The annual change in new business applications shows a fluctuating trend over the years, with significant growth in certain periods, particularly during the pandemic.
- 2012: 2.58 million
- 2013: 2.61 million
- 2014: 2.67 million
- 2015: 2.82 million
- 2016: 2.98 million
- 2017: 3.20 million
- 2018: 3.50 million
- 2019: 3.52 million
- 2020: 4.38 million
- 2021: 5.41 million
- 2022: 5.08 million
- 2023: 5.49 million
Key Insights:
- In 2020, there was a record-breaking surge of +24.5%, marking the most significant growth in the decade.
- 2021 also witnessed robust growth with a +23.5% increase, as many individuals turned to entrepreneurship in response to changing work dynamics and economic uncertainty.
- 2022 saw a contraction of -6.0%, showing that while entrepreneurship remained strong, there was some cooling off after the pandemic-related boom.
- 2023 experienced a rebound, with an +8.1% rise in new business applications, signaling a continued confidence in starting businesses, although at a more measured pace compared to the earlier surge.
These trends underscore how external events, like economic shifts or pandemics, can rapidly alter the landscape for entrepreneurship.
The pandemic served as a significant catalyst, with many individuals choosing to start their businesses.
2. Total Number of Small Business Applications Over the Years
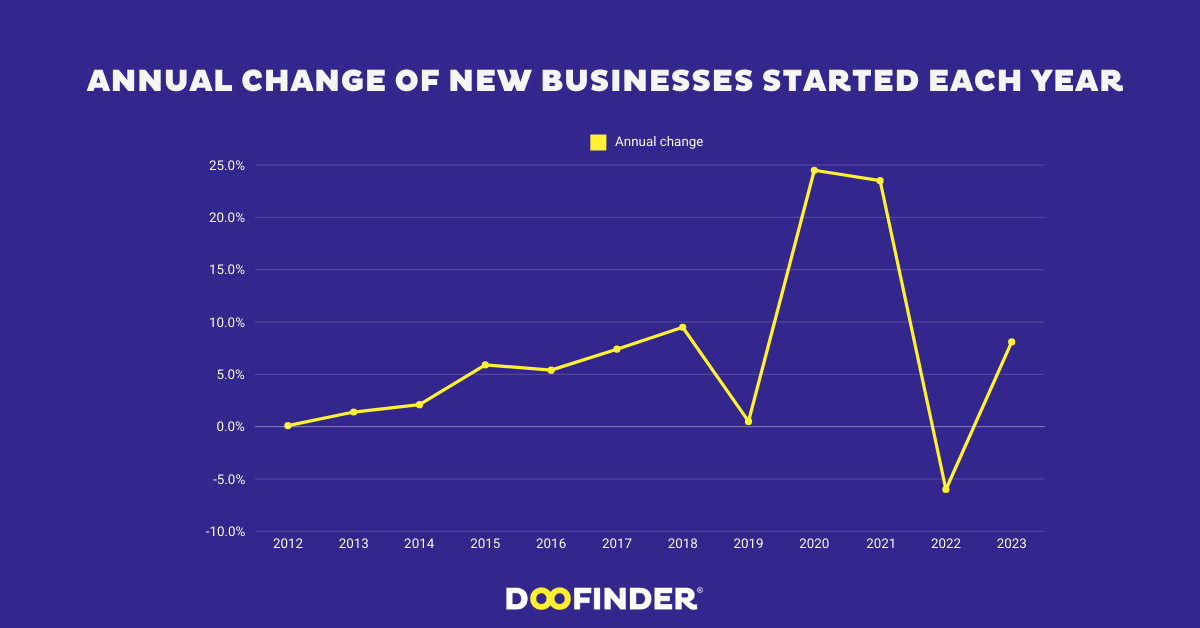
The total number of small business applications also paints a clear picture of how entrepreneurship has evolved, especially in the last few years.
- 2012: 0.1% annual change
- 2013: 1.4% annual change
- 2014: 2.1% annual change
- 2015: 5.9% annual change
- 2016: 5.4% annual change
- 2017: 7.4% annual change
- 2018: 9.5% annual change
- 2019: 0.5% annual change
- 2020: 24.5% annual change
- 2021: 23.5% annual change
- 2022: -6.0% annual change
- 2023: 8.1% annual change
Key Insights:
- In 2020, there was a massive jump in the number of applications to 4.38 million, from 3.52 million in 2019, an increase of 24.5%.
- The highest number of new business applications was recorded in 2021, reaching 5.41 million.
- 2022 saw a slight dip to 5.08 million, yet the overall number of new business applications remained well above pre-pandemic levels.
- In 2023, applications increased again, reaching 5.49 million, reflecting a resurgence of entrepreneurial activity.
This steady rise in new business applications over the years, with particularly notable increases in 2020 and 2021, reflects a broader cultural and economic shift towards entrepreneurship, likely driven by a mix of necessity, opportunity, and changing work preferences during and after the COVID-19 pandemic.
3. New Business Applications (Q1 2021 – Q2 2024)
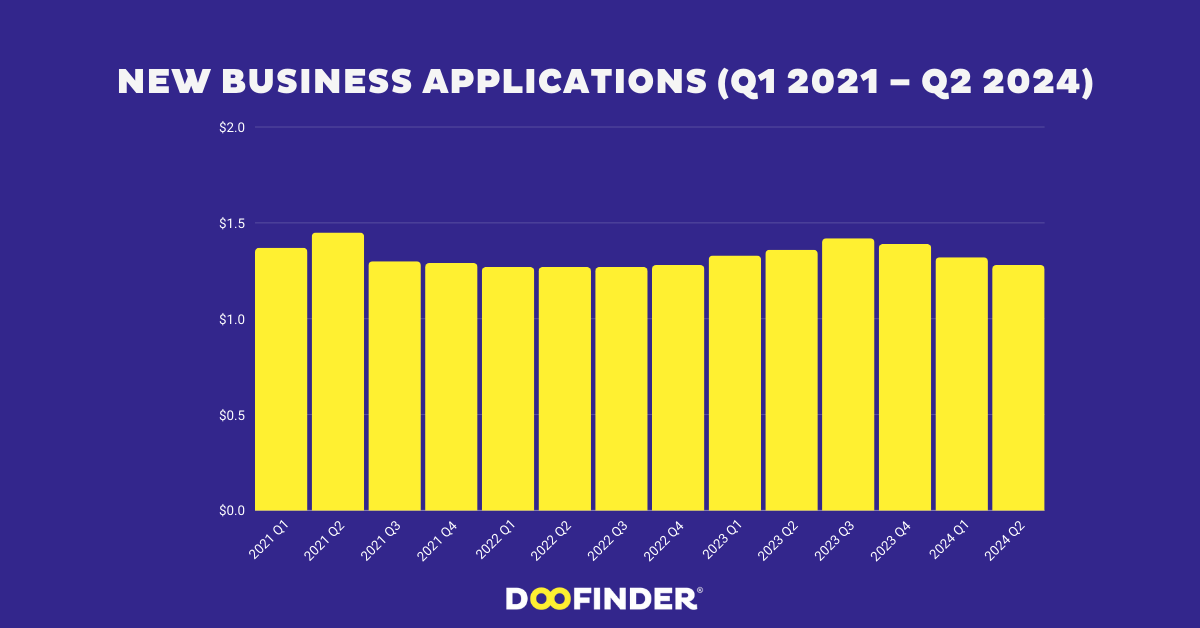
- 2021 Q1: 1.37 million applications
- 2021 Q2: 1.45 million applications
- 2021 Q3: 1.30 million applications
- 2021 Q4: 1.29 million applications
- 2022 Q1: 1.27 million applications
- 2022 Q2: 1.27 million applications
- 2022 Q3: 1.27 million applications
- 2022 Q4: 1.28 million applications
- 2023 Q1: 1.33 million applications
- 2023 Q2: 1.36 million applications
- 2023 Q3: 1.42 million applications
- 2023 Q4: 1.39 million applications
- 2024 Q1: 1.32 million applications
- 2024 Q2: 1.28 million applications
Key Insights:
- 2021 Q2 had the most applications, with 1.45 million.
- New business formation remained stable throughout 2022, around 1.27 million per quarter.
- Applications surged again in 2023, peaking at 1.42 million in Q3 before slightly decreasing to 1.28 million in mid-2024.
4. New Small Business Applications: Top Industries
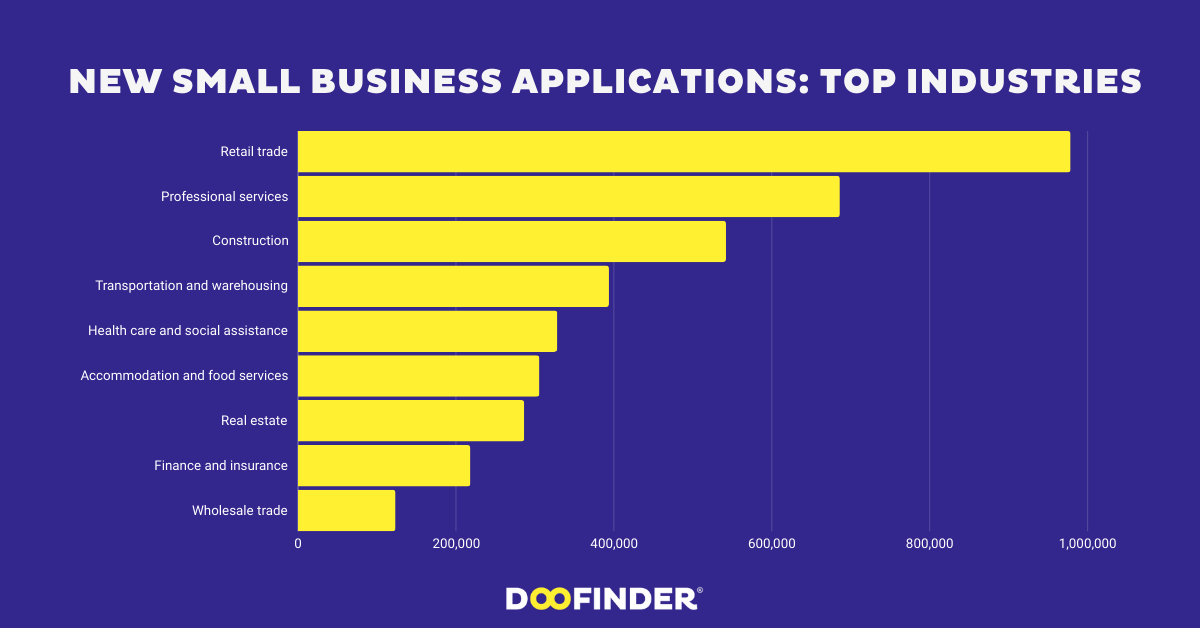
- Retail trade: 978,400 applications
- Professional services: 686,200 applications
- Construction: 542,000 applications
- Transportation and warehousing: 393,800 applications
- Health care and social assistance: 328,400 applications
- Accommodation and food services: 305,700 applications
- Real estate: 286,500 applications
- Finance and insurance: 218,300 applications
- Wholesale trade: 123,500 applications
Key Insights:
- Retail trade dominates, with 978,400 applications, reflecting the ongoing strength of e-commerce and brick-and-mortar retail.
- Professional services follow with 686,200 applications, indicating growing demand for specialized skills like accounting, law, and consulting.
- Construction and transportation/warehousing are also major growth areas, reflecting continued demand for infrastructure and logistics.
5. New Business Applications by State
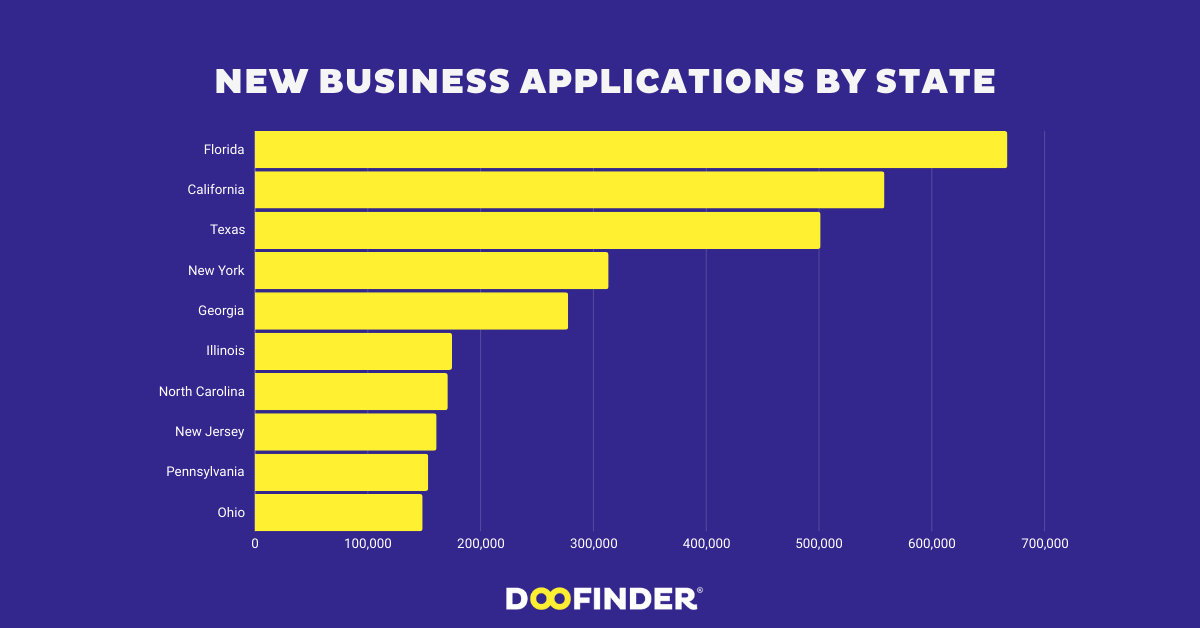
- Florida: 667,031 applications (the most in the U.S.)
- California: 558,011 applications
- Texas: 501,398 applications
- New York: 313,481 applications
- Georgia: 277,626 applications
- Illinois: 174,667 applications
- North Carolina: 170,924 applications
- New Jersey: 160,996 applications
- Pennsylvania: 153,599 applications
- Ohio: 148,623 applications
Key Insights:
- Florida is the leading state for new business applications, with over 667,000 applications in 2023.
- California and Texas follow, each with over 500,000 applications.
- New York and Georgia also rank highly, with over 300,000 applications each, reflecting strong entrepreneurial activity in these states.
6. Fail Rates of Businesses That Started in 2018
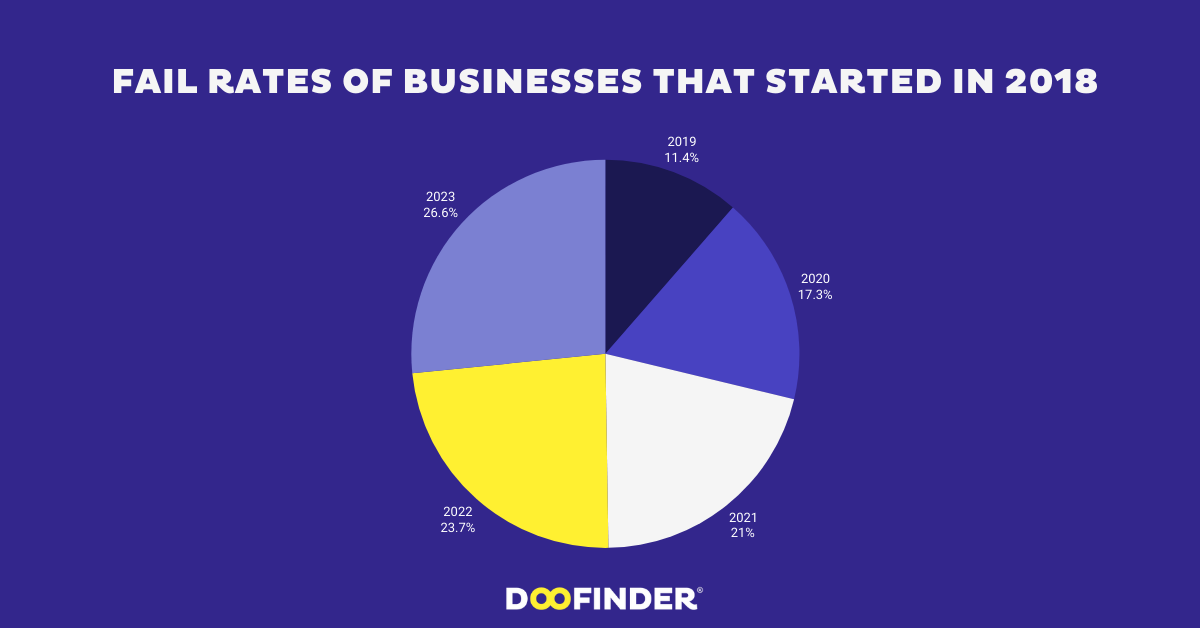
- 2019: 20.6% of businesses that started in 2018 had failed.
- 2020: 31.3% had failed.
- 2021: 37.9% had failed.
- 2022: 42.7% had failed.
- 2023: 48.0% had failed.
Key Insights:
- Nearly 48% of businesses that started in 2018 had failed by 2023.
- The failure rate increased each year, with the largest jump between 2022 and 2023.
- These statistics emphasize the importance of resilience, adaptability, and careful planning for new businesses to survive long-term.
What Does All This Data Tell Us about How Many Businesses Are Started Every Year in the United States?
Over the past few years, there’s been a significant increase in new business applications, especially in industries like retail trade, professional services, and construction. States like Florida, California, and Texas are leading the charge, showing high levels of entrepreneurial activity.
However, the data also shows that running a business is challenging. Nearly half of businesses that started in 2018 didn’t make it to 2023, underscoring the risks involved in entrepreneurship.
For those considering starting a business, this information is invaluable. Whether you’re deciding on an industry, location, or simply looking to understand the risks, staying informed is the best way to succeed in today’s entrepreneurial landscape. Remember, timing, planning, and flexibility are key to turning your business idea into a thriving success.

Source Acknowledgment: The data and statistics presented in this article are drawn from reliable sources, including Statista, Insider Intelligence, Data Reportal, and Census.gov. These respected organizations are recognized for delivering accurate and trustworthy information, supporting the credibility of the insights provided.


